|
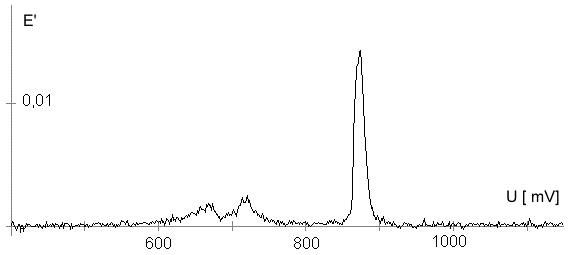
AbstractBy using the „Electric Field Coupled Electrode“ it is possible to control the current of an electrode by means of an electric field without the necessity of changing the electrode potential. This is realised by inducing via a micro disc electrode an electric field, which controls the ion transport from and to the electrode. The current can be adjusted independently to the potential of the electrode. Consequently, the „electric field coupled electrode“ method represents a novel electrochemical measurement method, which probably can be used both in the qualitative and in the quantitative analysis as well as in the online process monitoring. Keywords: Electric Field Coupled ElectrodeIntroductionIn the past decades, attempts were made in electrochemistry to improve the measurement technique, e.g. the redox potential measurement at gold and the voltammetry at platinum, to achieve an exact and reproducible science. However, the factors having an influence on the current or the voltage at an electrode are numerous to such an extent that they cannot be eliminated completely by means of a specific electrode surface or by superimposing an AC voltage. The electrode reaction can be classified on principle in two steps, the transport of charged material to or from the electrode and the electron transfer close by the electrode. In particular the transport of the charged particles contributes to the electric current as the potential gradient between the electrolyte and the electrode has to be overcome. Moreover, many attempts were made to manage the charging currents or to describe them so that the effect thereof on the electrochemical measurements can be considered [1]. It was proved by simple calculations that very strong forces are involved in building up charging currents [2]. So, an ion moves in the outer border of the electric double layer in an electric field of 109 Vm‑1. This is based on the assumption that in a layer of 1 nm thickness a potential difference of 1 Volt can be established. This strong attractive force via such a small distance compulsively leads to a great capacity and thus to coulomb currents. In relation to the conversion of material, which also can be expressed as current equivalent, they are very high. As a consequence, mainly charging currents are measured, when the potential is varied quickly. In case of microelectrodes [3-6] this effect seems to be lowered more and more as the hemispheric, i.e., nonlinear, diffusion close by the electrode leads to enhanced mass transfers. The influence of the charging current in relation to the mass transfer decreases by reducing the active electrode surface, accordingly the double layer is more unstable. Thus, on the basis of the above described facts, at micro electrodes the current can be influenced more easily with an electric field. For the electric field this control system allows only a low current flow, i.e., only the mass transport contributes to the current flow and no charging currents are formed. If now the electrode potential at the working electrode is changed this causes not a change of the current, however, the field strength of the electric field is regulated. In particular, the field strength will be changed if the change of the potential induces further oxidizing and reduction processes contributing to the current flow. By scanning a redox potential range at the working electrode using this measurement setup, steplike E-field/electrode potential diagrams are obtained. Herein a constant electric field means that no reactant contained in the electrolyte, which could be oxidised or reduced, was added in this redox range. At the point of a sudden increase or decrease of the field strength a redox potential is reached at which a reactant contained in the electrolyte is oxidised or reduced, respectively. Its contribution to the current flow is detected and is compensated by the electric field via the controlled system. The derivation of this steplike control curve results in a curve consisting of peaks. These peaks correspond to the redox potentials of the material to be analyzed. The quantification of the substance is possible by means of the peak integral. It was the object of this work to develop a measurement setup permitting at the working electrode, only, the low currents resulting from the ion transport. This current is controlled by an electric field superimposed on the working electrode. By means of a defined controlled system the electric field maintains the measured current at a preset value. The working electrode can be or cathodic. For the anodic working electrode this means that only the cations moving away from the electrode and the anions moving towards the electrode contribute to the measured current resulting from oxidation processes. This is valid also for the cathodic version of the working electrode and the reduction processes.ExperimentalIn the course of this work disc electrodes made of platinum with 0.5, 1.0, and 10 µm diameter were used. A dilute sulphuric acid having a concentration of 0.1 to 0.5 M was used as the electrolyte. An Ag/AgCl-electrode in 3 M KCl served as reference electrode, which simultaneously was the counter electrode because of the low currents. Unless not otherwise mentioned, all potential values refer to ground in the case of electronics and to the standard hydrogen electrode in the case of electrochemical potentials. The whole setup of the electrodes and micropositioning devices was made of fat free glass to avoid fault currents. During the measurements the equipment was placed in a double-walled faraday cage which was suspended free from vibrations. A pin point made of stainless steel having a radius of curvature lower than 5 µm was used to project on the working electrode an electric field as strong as possible. The pin point was positioned exactly above the working electrode by means of a manual positioning device. The distance between the working electrode and the pin point was approximately 15 µm. This leads to an electric field (working electrode - pin point) which was aligned almost parallel to the natural field (working electrode - electrolyte). An electrically insulating mica flake having a thickness of 5-6 µm was positioned between them (Figure 1). The measurements were carried out using a newly developed electric circuit [7], allowing an exact adjustment of the redox potential at the working electrode. Further, the circuit was extended such that it was possible to adjust a constant voltage of up to ±350 V or a variable voltage of ±45 V between the working electrode and the pin point. The field strengths achievable ranged up to 107 V/m for a static field and up to 106 V/m for a variable field.The scan speed usually was 100 mV/sec. For the dissolution of the double layer scan speeds of 10 mV/sec were used. Figure 3 shows a photo of the complete experimental setup. In the centre of the equipment the electrode suspension made of glass is seen. In the outer area of the faraday cage the measuring and controlling electronics for measuring the current and for the electric field are installed. Below the inner faraday cage a glass container was mounted, in which 39 piles of the 9 V block type (PP3) are located. This array supplies the necessary voltage for the electric field at the working electrode. ResultsBehavior of the Current at a Static Electric FieldInitially, a cyclovoltagramm in 0,2 M sulfuric acid was measured at a micro-disk-electrode having a diameter of 1 µm with a scan speed of 100 mV/sec. Next, a strong and static electric field was induced via the working electrode. The field strength was approximately 107 V/m, resulting from a distance between the electrodes of 15 µm and a voltage difference of 150 V. Under this conditions and after about five prescans another scan was recorded with a speed of 100 mV/sec and analyzed. Figure 4 shows two scans exhibiting at the 1 µm working electrode a uniform difference in current of 1,42 nA on the average across the entire scan range. The characteristic of the cyclovoltagrams was maintained. The working electrode exhibiting the cathodic current was connected positive with reference to the E‑field electrode.Conditioning - Elimination of the Double LayerThe measuring circuit was extended so that the measured current signal influences the electric field via a controlled system. A double integrator proved to be suitable as a controlled system as it filtered the noise out of the signal and the controlled system. Dynamic influences of the controlled system, which will cause uncontrolled reactions at the working electrode by having an influence on the electric field were eliminated. The first measurements using the described method showed that the forces present in a double layer were very high, even at a micro-disk-electrode with an diameter of 10 µm. In this case a potential range from ‑50 mV to 1500 mV was scanned and the control curve for the E‑field was recorded. For the moment, no essential influence of the electric field could be detected. The current behaved similar as in the static field and was shifted at about a few pA. When the current passed the zero line it was observed, expectedly, how the control system made the spontaneous change of the electric field to the other maximum. However, even during many scans the electric field could not regulate the current at its preset set point and keep it constant. Only when the scans were set at the redox range of 150 - 250 mV, the thin layer area, at a scan speed of 10 mV/s or less, the dissolution of the double layer began. This potential range was used as the thin layer area exhibits the lowest electron density. The dissolution of the double layer was apparent in that the control curve no longer changed immediately from one maximum to the other, but took over the regulation of the current for a small scan range of about 10 mV. The current levelled off at its preset set point for this range to subsequently flow almost independent of the electric field (Figure 5). It is important, that after about six scans and after the zero line was passed the control system of the electric field completely took over the control of the current (Figure 6).The Control Curve of the Electric Field at Constant Current at the Working ElectrodeThe positive preset current (anodic working electrode), which should be regulated by the E‑field, was adjusted at 10 pA. This is about 1% of the maximal measured current range, with which the cyclovoltagrams previously have been recorded at the working electrode. In the redox range (Figure 7) of 600 mV to 900 mV three points of inflection are perceptible. They are located at 670 mV, 710 mV and 870 mV.DiscussionCurrents at an ElectrodeAs soon as a potential is applied at two electrodes in an electrolyte a current starts flowing. For measuring a current, charge carriers, ions or electrons, have to overcome a resistance. The decisive resistance limiting the current at an electrode is the exit or the entry of an ion out of or in the double layer, respectively, between the electrode surface and the electrolyte [10,11]. According to Ohm’s law, the current flow is dependent from the voltage via the resistance. In addition to the voltage, being supplied to the electrodes by a voltage source, a galvanic half cell is formed by the reactions of the electrolyte with the electrode material. This second voltage source is in a serial connection with the generated circuit. Further, the electrode surface and the ions form a double layer, which is comparable to a capacitor having a variable capacity. If the preset voltage now steadily varied as well, like in cyclovoltammetry, a further voltage source, namely that of a capacitor in an alternating field, results. Thus, the following three factors are responsible for the current flowing at an electrode:
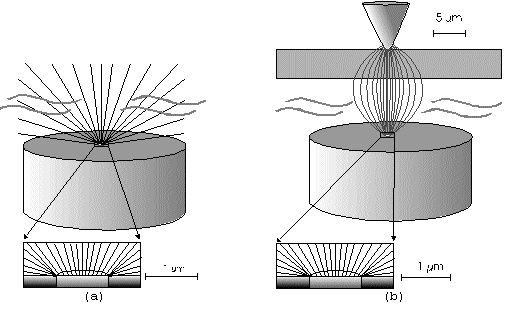
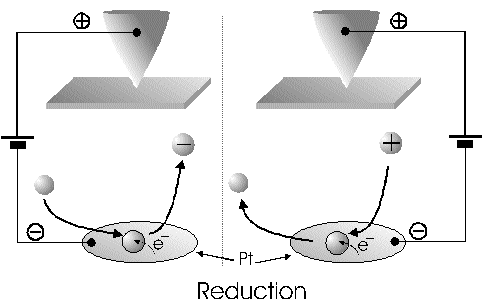
The Alignment of the Field Lines at a Micro-Disk-ElectrodeFor this application micro-disk-electrodes with 0.5, 1.0, and 10 µm in diameter proved to be useful. Because of the increased mass transports [4,12,13] at the electrode surface the effects of the electric field could be observed best thereon. Figure 9 shows the field lines at the micro-disk-electrode, under the provision that a double layer on the electrode surface was not formed yet. The center of the working electrode exhibits field lines which are extending almost parallel. At the edge of the electrode the field lines are oriented radial. The orientation of the field lines at these working electrodes can be expected as being parallel for both the natural field (a) and the induced electric field (b). As a result of the compensation of parallel oriented filed lines inhomogeneities close by the electrode are excluded.The maximal useable field strengthsWith the used battery block a static E‑field having a maximum potential difference of about 350 V can be generated. The availability of high-voltage operational amplifiers limits the maximum range of voltage for variable field strengths to ± 45 V. Thus, with a distance of the electrodes of 15 µm the maximal attainable field strength was only 3•106 V/m. The relative dielectric constant of the insulator, which consists of mica at all measurements, has a value of four to eight. This value is relatively low and thus can be ignored. The relative dielectric constant of the aqueous electrolyte is 80; however, it can be left out of consideration as it is valid for both the natural and the induced field [15]. If capacitors are connected in series the total voltage is a result of the partial voltages at the single capacitors: U = U1 + U2 + U... According to the relationship 1/C = U/Q, wherein the amount of charge Q in the case of a serial connection is identical on each capacitor, it follows that 1/C = 1/C1 + 1/C2 + 1/C... For C = e0 ex • A/d it follows that for two different dielectric materials the voltage drop according to 1/C = de0/A (1/e1 + 1/e2 + 1/ e....) for e (H2O) = 81 and e (mica flake) = 4 to 8 is a result of the ratio. For the worst case a voltage ratio of 1:20 was calculated at the two capacitors. The conclusion from these calculations is, that not a electric field of 3 MV/m, as assumed but only a field strength of 150 KV/m is necessary to measure this effect.Behaviour of the Current at a Static Electric FieldThe measurements of cyclovoltagrams with an electric field of constant field strength with 500 KV/m showed good results. At a field strength of 107 V/m, i.e., a 1/200 of the maximal expected field strength in the double layer [14], an influence on the measured current was seen. As the working electrode was connected positive in relation to the E‑field electrode, the electric field caused a current being more negative on an average of 1,42 nA. This might be explained with an increased migration of cations to the working electrodes. As a consequence, the number of reductions is increased and the current decreases. Despite of the strong field of about 100 MV per meter, the characteristic of the cyclovoltagram was completely maintained. This confirms the proper functioning of the electric circuit and the insulation of the experimental setup. These preliminary tests prove that the current at the working electrode can be influenced with an electric field without suppressing the specific redox reactions.4.5. Theoretical and Experimental Description of the Fault Currentsheoretical / CalculationThe resistance of the isolator (mica) from the pinpoint to the electrolyte is a series connection. All parts of the setup were cleaned with acetone to reduce the effects of secondary resistance or reactance, respectively. Considering the specific conductivity, the transitions electrolyte/mica and mica/metal point have to be considered. Thus, the resistance of the electrolyte side can be calculated as follows: lR = r • ------- r = specific resistance A The specific conductivity of the mica is 1013 to 1015 Ohm. It is supposed the value of the worst isolation, 1013 Ohm. The length of the isolator is 6 µm. The area moistened by the electrolyte is generously estimated as being 1 cm2. Thus, the resulting resistance is 6 • 1011 Ohm. Correspondingly, the resistance is built-up between the pin and the other side of the isolating layer. For this calculation the length and the specific resistance of the isolator remain constant. However, the conducting contact area of the pin point is varied. The curvature radius of this point is 5-10 µm. By assuming a maximum contact about 10‑10 m2 will be covered. This corresponds to a resistance of 1017 Ohm. This high resistance can only be caused by a pin point contacting an isolator. The maximum theoretical current at 1000 V would be 10 fA. In this calculation the electrons tunneling the isolator have not been taken into consideration. The Experimental ProofNaturally, the reference electrode was removed from the electric circuit to measure the real fault currents and to compare them with the calculated ones. No shift of the base line could be recognized. A very low fault current was confirmed which was about one to two decades higher than the calculated fault current. The measured current in the range of 10‑9 A is too high for the fault currents, which have been experimentally verified in the range of 10‑12 A to 10‑13 A, to have a decisive influence. For measuring the currents a highly sensitive circuit was used to measure currents down to the lower A range (see publication in the known magazine: Elektronik)Conclusions from the Measurements with a Static Field StrengthAs the fault currents and the resistances (see calculations) seem not to be responsible for the y-shift of the cyclovoltagram other physical parameters have been changed to confirm the influence of the electric field. Thus, the position of the pin point was varied several times to exclude the measurement of artifacts. On that occasion it could be further noticed that the position of the pin point below the micro-disk-electrode is especially important. A horizontal drift of the pin point of some µm from the centre line considerably reduces the influence of the electric field on the current. The change of the isolator (mica platelet), however, had no measurable influence. Accordingly, as a result of all measurements only electrochemical processes may be hold responsible for the Y-shift until now. It follows, therefore, that further investigation of which reactions can be held responsible for the reductions at 1.4V (versus NHE), is required. However, it obviously can be assumed that the change of the gradient of the electric field over the electrode is the reason for the Y-shift. Likewise, it is surprising that the characteristic of the cyclovoltagram is not noticeably varied under the influence of the high electric field . This fact leads to the conclusion that the build-up of the inner and outer Helmholtz planes is not considerably changed by a constant electric field. Thus, if the current can be influenced by a static electric field, the current can be controlled with a variable electric field accordingly. So if the current can be held constant and very low in this manner and nevertheless, the redox reactions take place without building a double layer, how will the field strength than behave ? We will start with an imaginary experiment comprising a low anodic current which is held constant by the electric field. At a preset redox potential for instance two reactants are oxidized at the working electrode. One might be a cation which was oxidized at the working electrode and then pushed out of the area of influence of the electric field. Again another reactant might be an anion being attracted by the working electrode and likewise oxidized thereon (Figure 10). Then, the redox potential is steadily increased. Because of the electric field via the control system the current further remains constantly low. Instead of the redox potential where a further reactant is oxidized, the current will be increased, because a higher amount of ions are available for the current (ion transport). For the hypothetical case that a further reactant is generated by oxidation, then instead of the previous two types of ions there are three types available for the current flow. The current would rise if the E‑field is not readjusting. This control curve is recorded and indicates at which redox potential a reactant is added. The known reactions at the respective electrode potential as well as the behavior of the charging current remain unchanged. These facts have been discovered experimentally and have to be further investigated in the future.The Control Curve of the Electric Field for a Constant and Small Anodic CurrentWith this measuring arrangement a electrode potential range of 400 - 1150 mV was scanned at the working electrode. As expected a step like control curve E‑field/redox potential was obtained, which was reproducible. Electrode potential ranges having an almost constant electric field indicate that the number of reaction systems remain constant. At the place of an abrupt increase of the field strength a redox potential is reached at which another substance in the electrolyte is oxidized. This substance increases the current flow at the working electrode. Its contribution to the current is detected by the measuring system and compensated by the E‑field via the controlled system. Although a reactant was added at the redox potential of 870 mV for instance, the current is further maintained at 10 pA by the electric field. Therefore, the result of the added reactant is a change of the field strength. If the derivation of the controlled system is calculated (Fig. 8) every peak, i.e., every potential, can be assigned to a substance.Cathodic Current at the Working ElectrodeUntil now, for a better understanding and a better overview in the illustrations an anodic current was assumed at the working electrode. An anodic current means, that only oxidation reactions can be observed. Correspondingly, a cathodic current can be preset at the working electrode with the given measuring system. With that, reductions are visible at the working electrode (see Figure 11). In this case anions migrate away from the working electrode independently from the redox potential, whereas cations are migrating to the electrode, where they are reduced according to their redox potential. Neutral particles fill up formed gaps, however, they make no contribution to the current flow. As in this case the current has to be compensated in the other direction of the electric field, the steps in the conventional illustrations are extending from the upper left to the lower right. Because of the particular behavior of the control curve it can be assumed that it comes to a removal of the outer Helmholtz layer. The scan speeds have no influence on the current and thus on the regulated electric field. However, despite of the superimposed field, it can be assumed that the inner Helmholtz plain still exists and, in addition, is responsible for the characteristic of the control curve. Thus, it could be shown in the preliminary tests that because of the different occupation of the electrode surface the back and forward scans are different, however, both are showing the same number of steps. This aspect will be referred to in future publications when to each step a substance or reaction can be assigned.Improvements of the Present Measurement SystemAlthough the electrode potential ranges in an aqueous medium could be scanned from ‑2.5 V to 2.5 V, at the moment no results are present which can be evaluated. The control curves measured with the measuring system had such low signal levels that no steps could be recognized over the whole range. The derivation over the whole range results merely in a noise. A moving average according to the algorithm of Savitzky and Golay [17] or a digital low pass filter by means of a fast Fourier transformation (FFT), which nowadays are also used in cyclovoltammetry [18,19], would certainly contribute to an improvement of the measuring system. In the future, it is intended to abandon additional computation algorithms. It rather should be an object to improve the electronics and the measuring arrangement. This makes the method more transparent for the user and it will become a fast and inexpensive method applicable in various fields of the analysis of fluids, liquids and gases.ConclusionsAs very small electrodes can be used, a realization of the whole measuring system in the semiconductor technology is possible. This is a great advantage with respect to the development of a robust analytical measurement method especially in the field of sensor technology, as extremely small sample volumes can be analyzed therewith. Because of the very small size only a small amount of noble metal is necessary for this sensor. For the circuit responsible for the measurement of the low currents in the range of picoampere and femtoampere [20] and for the complete control of the electric field, at the moment only four operational amplifiers are needed. If necessary, they could also be placed on the semiconductor array next to the AD-/DA-transducer and a small processor.AcknowledgementThe electrode material was kindly donated by W.C. Heraeus GmbH, Hanau (Germany). This contributed to a great extent in this successful work. The concept phase concerning the further development of the presented method to series maturity, is supported by the Bavarian State Ministry of Economic Affairs, Transport and Technology.Literature* D. Ende, K. Mangold, Impedanzspektroskopie, Chemie in unserer Zeit, 1993, 3, pp.134-140. * P. Atkins, Physikalische Chemie, Verlag Chemie Weinheim, 1987, pp. 811-822. * J. Heinze, Theory of cyclic voltammetry at microdisk electrodes, Ber. Bunsenges. Phys. Chem., 1991, 85, pp. 1096-1103. * H. Emons,Voltammetrische Analytik mit Mikroelektroden, GIT Fachzeitschrift, 1996, 3, pp. 204-208. * H. Emons, Voltammetrische Analytik Anorganischer Stoffe, Analytiker- Taschenbuch Springer Verlag, 1995, 13, pp.111-139. * K. Vetter, Electrochemical kinetics - theoretical and experimental aspects, übersetzt von Scripta Technica, Academic Press, New York, 1967. * P. Schönweitz, Untersuchungen zu Meßverfahren in wässerigen Medien, Dissertation TU-München, 1997, pp. 40-44. * H.Wupper,Professionelle Schaltungstechnik mit Operationsverstärkern, Franzis-Verlag, 1994, pp. 41-45, pp. 142-147. * H.Wupper, U.Niemeyer, Elektronische Schaltungen 2, Springer-Verlag Berlin, 1996, pp.74-78. * J.Braunsburger, Dynamische Analyse elektrochemischer Reaktionssysteme, Deutscher Verlag für Grunstoffindustrie, 1994, pp.41. * W. Schmickler, Grundlagen der Elektrochemie, Vieweg Lehrbuch Physikalische Chemie, 1996, pp. 120-125. * R. Menzel, Ein voltammetrisches Multifunktions-Sensorsystem für wässerige Medien, Dissertation TU-München, 1993, pp. 96-103. * R. Wightman,Voltammetry with Microscopic Electrodes in New Domains, Science 1988, 240, pp. 415-420. * P. Atkins, Physikalische Chemie, Verlag Chemie, Weinheim 1987, p.817. * J. Grehn, Metzler Physik, Vieweg GmbH Düsseldorf, 1981, p.218. * Feldelektronenmikroskop, Fachlexikon Physik, Verlag Harri Deutsch, Zürich, 1974, 1, 457. * Savitzky, M.J.E. Golay, Smoothing and Differentiation of Data by Simplified Least Squares Procedures, Anal. Chem. 1994, 36, pp.1627-1639. * W. Amslinger, Computerbasierte Meßwerterfassung für die cyclovoltammetrische Untersuchung von Organometallverbindungen und technischen Elektrodenmaterialien, Dissertation TU München 1991, pp.33-36. * D. Gosser,Cyclic Voltammetry – Simulation and Analysis of Reaction Mechanisms, VCH-Verlag Wenheim, 1994. * P. Schoenweitz, Elektronik – Attoampere einfach messen, WEKA Zeitschriftenverlag GmbH, 1999, 5, pp.101-103
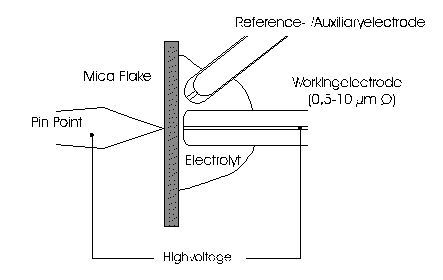
Figure 1 Schematic view of the electrode arrangement.
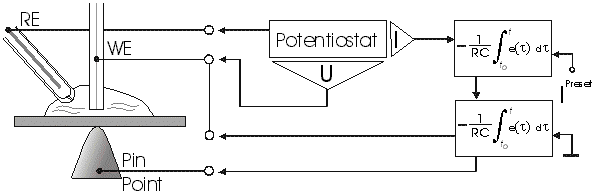
Figure 2 Schematic view of the experimental setup
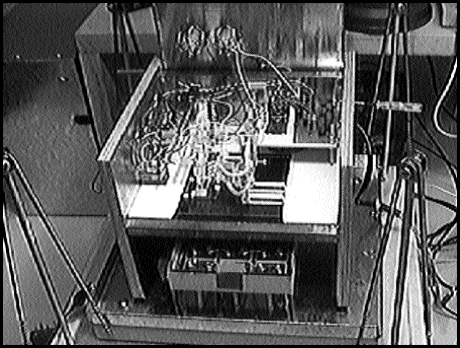
Figure 3 Picture of the experimental setup
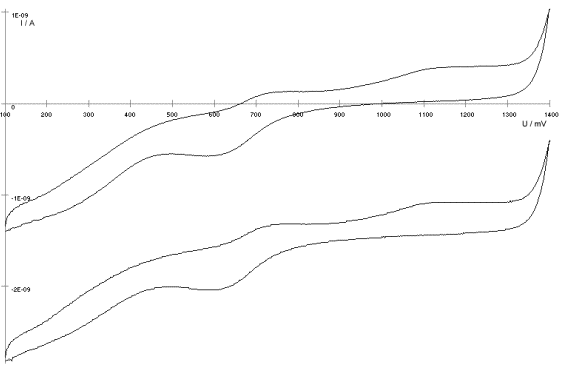
Figure 4 The upper scan shows a cyclovoltagramm without the influence of an electric field. The lower scan was recorded under the influence of a field strength of 108 V/m.
Figure 5 Cyclovoltagrammic scan under influence of the regulated electric field. The thin line represents the I/U-curve; the thick line represents the E/U-curve)
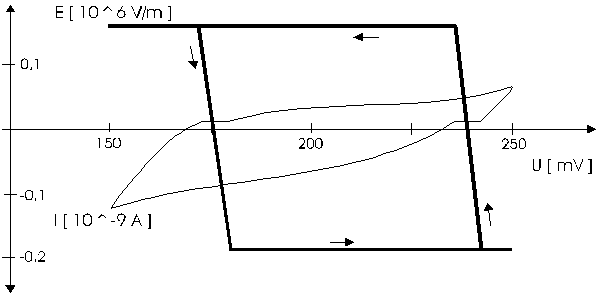
Figure 6 The electric field takes over the control of the current after the zero line was passed. The thin line represents the I/U-curve; the thick line represents the E/U-curve
Figure 7 Control curve of the electric field, recorded in 0,1 M sulfuric acid after eliminating the double layer.
Figure 8 Derivation of the control curve of the electric field.
Figure 9 Alignment of the electric field lines in the electrolyte (a) and that of the field (b) induced by the pin point. Figure 10 Schematic view of the reactions being possible at an anodic current. Figure 11 Schematic view of reactions, being possible at a small cathodic current. |